October 21
QE Ad Infinitum: Why QE is Not Reviving Growth
In a speech in November of 2002, Fed chairman Ben Bernanke made the now infamous statement, “the U.S. government has a technology, called the printing press, that allows it to produce as many U.S. dollars as it wishes essentially at no cost,” thus earning the nickname “Helicopter Ben“. Then, he was “confident that the Fed would take whatever means necessary to prevent significant deflation”, while admitting that “the effectiveness of anti-deflation policy would be significantly enhanced by cooperation between the monetary AND fiscal authorities.”
Five years after the 2008 financial crisis, Helicopter Ben undoubtedly has a greater appreciation for the issues the BoJ faced in the 1990s. The US 10-year treasury bond (as well as global bond) yields have been in a secular decline since 1980 and hit new historical lows after the crisis. What the bond market has been telling us even before the QE era is that bond investors expect even lower sustainable growth as well as ongoing disinflation/deflation, something that Helicopter Ben has been unable to eradicate despite unprecedented Fed balance sheet deployment.
A Broken Monetary Transfer Mechanism
Effective monetary policy is dependent on the function of what central bankers call the Monetary Transmission Mechanism, where “central bank policy-induced changes in the nominal money stock or the short-term nominal interest rate impact real economy variables such as aggregate output and employment, through the effects this monetary policy has on interest rates, exchange rates, equity and real estate prices, bank lending, and corporate balance sheets.”
Yet two monetary indicators, i.e., the money multiplier and the velocity of money clearly demonstrate that the plumbing of this monetary transmission mechanism is dysfunctional. In reality, the modern economy is driven by demand-determined credit, where money supply (M1, M2, M3) is just an arbitrary reflection of the credit circuit. As long as expectations in the real economy are not affected, increases in Fed-supplied money will simply be a swap of one zero-interest asset for another, no matter how much the monetary base increases. Thus the volume of credit is the real variable, not the size of QE or the monetary base.
Prior to 2001, the Bank of Japan repeatedly argued against quantitative easing, arguing that it would be ineffective in that the excess liquidity would simply be held by banks as excess reserves. They were forced into adopting QE between 2001 and 2006 through the greater expedient of ensuring the stability of the Japanese banking system. Japan’s QE did function to stabilize the banking system, but did not have any visible favorable impact on the real economy in terms of demand for credit. Despite a massive increase in bank reserves at the BoJ and a corresponding increase in base money, lending in the Japanese banking system did not increase because: a) Japanese banks were using the excess liquidity to repair their balance sheets and b) because both the banks and their corporate clients were trying to de-lever their balance sheets.
Further, instead of creating inflation, Japan experienced deflation, and these deflationary pressures continue today amidst tepid economic growth. This process of debt de-leveraging morphing into tepid long-term, deflationary growth with rapidly rising government debt is now referred to as “Japanification”.
Two Measures of Monetary Policy Effectiveness
(1) The Money Multiplier. The money multiplier is a measure of the maximum amount of commercial bank money (money in the economy) that can be created by a given unit of central bank money, i.e., the total amount of loans that commercial banks extend/create. Theoretically, it is the reciprocal of the reserve ratio, or the amount of total funds the banks are required to keep on hand to provide for possible deposit withdrawals.
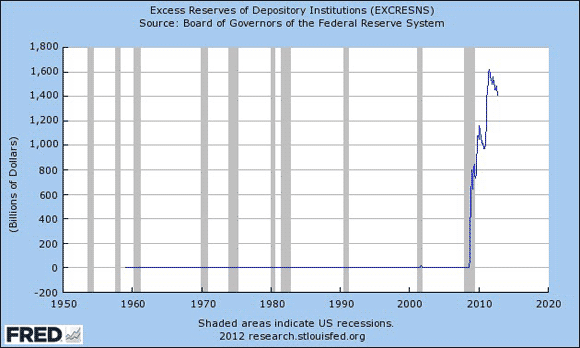
Since September 2008, the quantity of reserves in the U.S. banking system has grown dramatically. Prior to the onset of the financial crisis, required reserves were about $40 billion and excess reserves were roughly $1.5 billion. Following the collapse of Lehman Brothers, excess reserves exploded, climbing to $1.6 trillion, or over 10X “normal” levels. While required reserves also over this period, this change was dwarfed by the large and unprecedented rise in excess reserves. In other words, because the monetary transfer mechanism plumbing is stopped-up, monetary stimulus merely results in a huge build-up of bank reserves held at the central bank.
 |
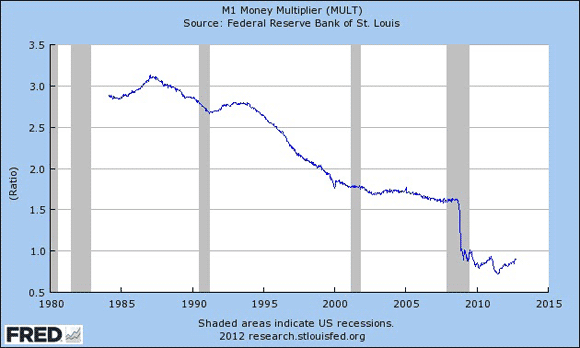
If banks lend out close to the maximum allowed by their reserves, then the amount of commercial bank money equals the amount of central bank money provided times the money multiplier. However, if banks lend less than the maximum allowable according to their reserve ratio, they accumulate “excess” reserves, meaning the amount of commercial bank money being created is less than the central bank money being created. As is shown in the following FRED chart, the money multiplier collapsed during the 2008 financial crisis, plunging from from 1.5 to less than 0.8.
Further, there has been a consistent decline in the money multiplier from the mid-1980s prior to its collapse in 2008, which is similar to what happened in Japan. In Japan, this long-term decline in the money multiplier was attributable to a) deflationary expectations, and b) a rise in the ratio of cash in the non-financial sector. The gradual downtrend of the multiplier since 1980 has been a one-way street, reflecting a 20+ year dis-inflationary trend in the U.S. that turned into outright deflation in 2008.
 |
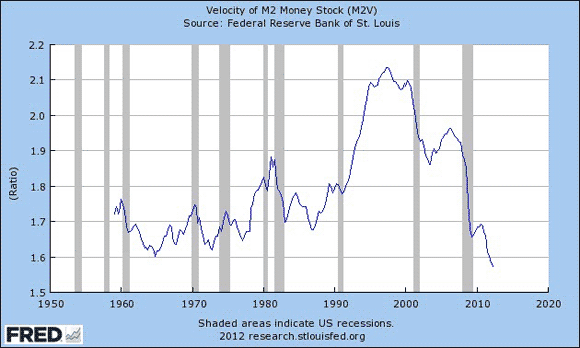
(2) The Velocity of Money. The velocity of money is a measurement of the amount of economic activity associated with a given money supply, i.e., total Gross Domestic Product (GDP) divided by the Money Supply. This measurement also shows a marked slowdown in the amount of activity in the U.S. economy for the given amount of M2 money supply, i.e., increasingly more money is chasing the same level of output. During times of high inflation and prosperity, the velocity of money is high as the money supply is recycled from savings to loans to capital investment and consumption.
During periods of recession, the velocity of money falls as people and companies start saving and conserving. The FRED chart below also shows that the velocity of money in the U.S. has been consistently declining since before the IT bubble burst in January 2000—i.e., all the liquidity pumped into the system by the Fed from Y2K scare onward has basically been chasing its tail, leaving banks and corporates with more and more excess, unused cash that was not being re-cycled into the real economy.
 |
Monetary Base Explosion Not Offsetting Collapsing Money Multiplier and Velocity
The wonkish explanation is BmV = PY, (where B = the monetary base, m = the money multiplier, V = velocity of money), PY is nominal GDP. In other words, the massive amounts of central bank monetary stimulus provided by the Fed and other central banks since the 2008 financial crisis have merely worked to offset the deflationary/recessionary impact of a collapsing money multiplier and velocity of money, but have not had a significant, lasting impact on nominal GDP or unemployment.
The only verifiable beneficial impact of QE, as in the case of Japan over a decade ago and the U.S. today is the stabilization of the banking system. But it is clear from the above measures and overall economic activity that monetary policy actions have been far less effective, and may even have been detrimental in terms of deflationary pressures by encouraging excess bank reserves. Until the money multiplier and velocity of money begin to re-expand, there will be no sustainable growth of credit, jobs, consumption, housing; i.e., real economic activity. By the same token, the speed of the recovery is dependent upon how rapidly the private sector cleanses their balance sheets of toxic assets.
QE falls into a black hole. And it leads into an – if possible even larger – black hole. Ben Bernanke and Mario Draghi have neither the power nor the tools to stop deleveraging and debt deflation. That’s just a myth they, and many with them who stand to benefit from that myth, like you to continue believing. It makes it all that much easier for them.
That surge in excess bank reserves (see the second graph above) comes from QE. It is your money, everyone’s money. And it does nothing to “heal” the economy you live in and depend on for your survival; it just takes away more of it all the time. That is the one thing Ben and Mario have power over: they can give money away that you will have to pay for down the line. They can lend it out to banks knowing that it will never be repaid, and not care one inch. Knowing meanwhile that you won’t either, because you don’t look at what’s down the line, you look at today, and today everything looks fine. Except for that graph, perhaps, but hey, how many people are there who understand what it says?
One thing Ben and Mario can not do, however, is create hyperinflation. They can’t even truly create any type of real inflation (which is money/credit supply x velocity vs goods and services), for that matter. They’re stuck as much as you yourself are in the dynamics of this bursting bubble.
